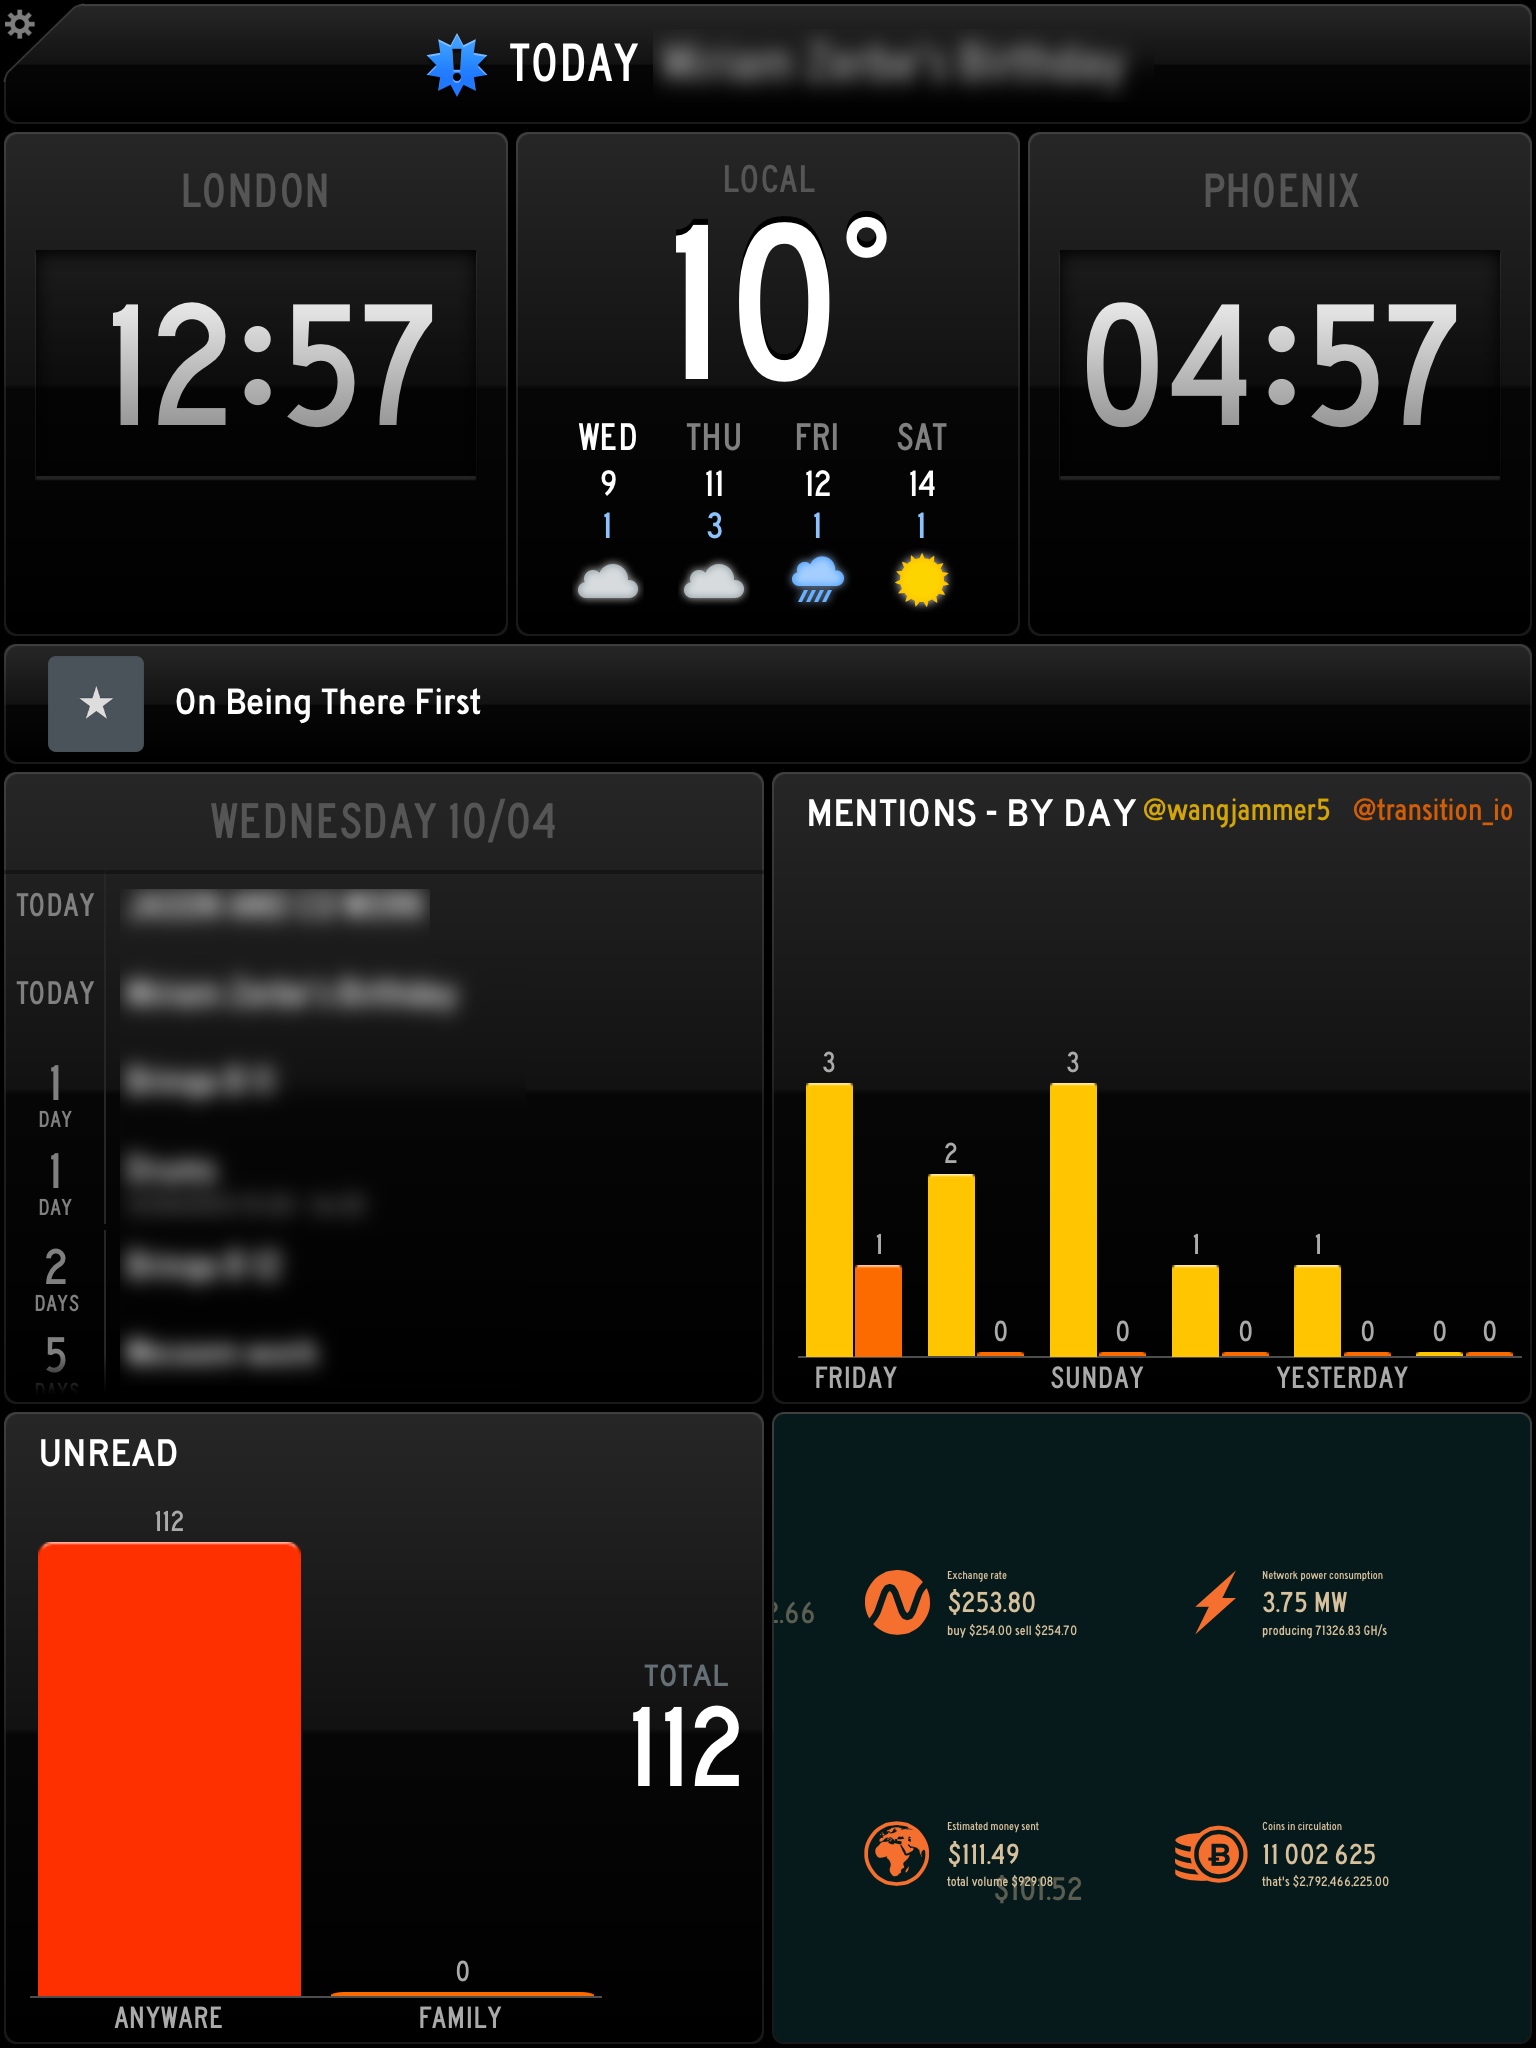
What a great surprise app release this is. You may remember that Panic created a storm when they blogged about the internal HTML status board they created for their development team, displayed on the wall on an HD TV.
A status board can be incredibly useful. For software development it is a great tool for keeping everybody abreast of the current situation across your products; support load, forthcoming deadlines, continuous integration build status and other info useful to your team. It’s all there at a glance, all automatically updated. Data is pulled in from a variety of sources to suit your team.
It should be pretty obvious that this can apply to most businesses. Perhaps you need to show targets and current sales levels, the customer service call queue stats, important dates. You may need to show the progress of various teams, or staff utilisation across timezones.
Well that blog post was a nearly three years ago now, and today Panic launched a native iPad application that brings this functionality to all of us.
The Status Board app for iPad is £6.99 in UK App Store which I didn’t hesitate to hand over. After just a few minutes playing with it I can see the potential here.
As you would expect from the team at Panic it looks great and the UI is simple.
This is a 1.0 so I found a few niggles already such as clocks getting stuck with a message about no internet access when I lost network for a while even when network returned, but they will be fixed promptly I am sure.
It makes it really easy to drop in “widgets” from the palette of available types, such as polling multiple mailboxes, Twitter accounts and RSS feeds. Each widget tends to have multiple ways of displaying them, often including a textual list or ticker as well as some graphs. Switching between them is easy, and when viewing the status board you can swipe charts to change the metric displayed.
Where things get really interesting is connecting to other services or custom data sources. The app can pull feeds for display as tables, charts or custom HTML panels.
Each of these has some instructions about how to generate the correct data for these feeds. This is where things get a bit sticky. Producing data in the right format is going to require some scripting elsewhere to pull your data out of whatever systems you have and then format it as per the Status Board requirements.
Allowing for the fact that this is a 1.0 release, I expect this to improve in future. Currently there are inconsistencies; Graphs can feed from CSV or JSON but Tables can feed from CSV or HTML (no JSON?). It would be nice to have JSON support across the board, and the option to pull info from more ubiquitous RSS feeds and built-in support for more popular web-services, or a “gallery” of recipes that can be accessed from inside the app, which users can then create and share with each other.
The problem is that the most useful data is usually protected or not readily available in a form that can be immediately used. I’d love to show my Tax Timeline and Invoice history from FreeAgent but I don’t see how this is possible without writing a script or web-app to pull data from FreeAgent API and reformat it and serve it under a “private” URL for Status Board.
The external HTML panel (“DIY” panel) is a quick workaround if you can’t produce the data you want in CSV or JSON easily if you have this displayed somewhere already. What’s also nice is that you can share entire boards with people and also link directly to “widgets” so that other people can use them. For example here’s how to embed the realtimebitcoin.info display:
panicboard://?url=http%3A%2F%2Frealtimebitcoin.info&panel=
diy&sourceDisplayName=realtimebitcoin.info
If you are viewing this on iPad and have the app you can test it by clicking this link
Interestingly Panic have already worked with Hockey and StatHat to provide integrations of App download statistics including iOS and Mac app crash reports and any stats logged to StatHat. I’m yet to play with this but it could be very useful.
What I haven’t mentioned so far is that you can hook this up to a big display using the HD TV output adapter for iPad or over AirPlay using Apple TV, with an extra in-app purchase. That is very cool and much less hassle than finding HTML-equipped TVs or other hardware to run a browser and the maintenance that involves. What’s more you can interact with it when running on the iPad, to scroll panels or swipe to change graph metrics.
All in all I’m really excited by this. On my wish list for improvements would be support for multiple-boards. While it is fair to say that the more information you present, the less useful the board as a whole is due to overload, it is inevitable that there will need to be support for automatically rotating boards that can show more than one screen of data.
Beyond this, I would also love app.net support, and extra “widgets” for displaying single numbers and status indications (colours) out of any feeds. Oh, and a “data feed wizard” that pulls in anything you give it, and lets you select how to display it as a table or chart. Think pulling in arbitrary JSON or RSS without having to serve it in the format Status Board currently expects.
Great work Panic!


